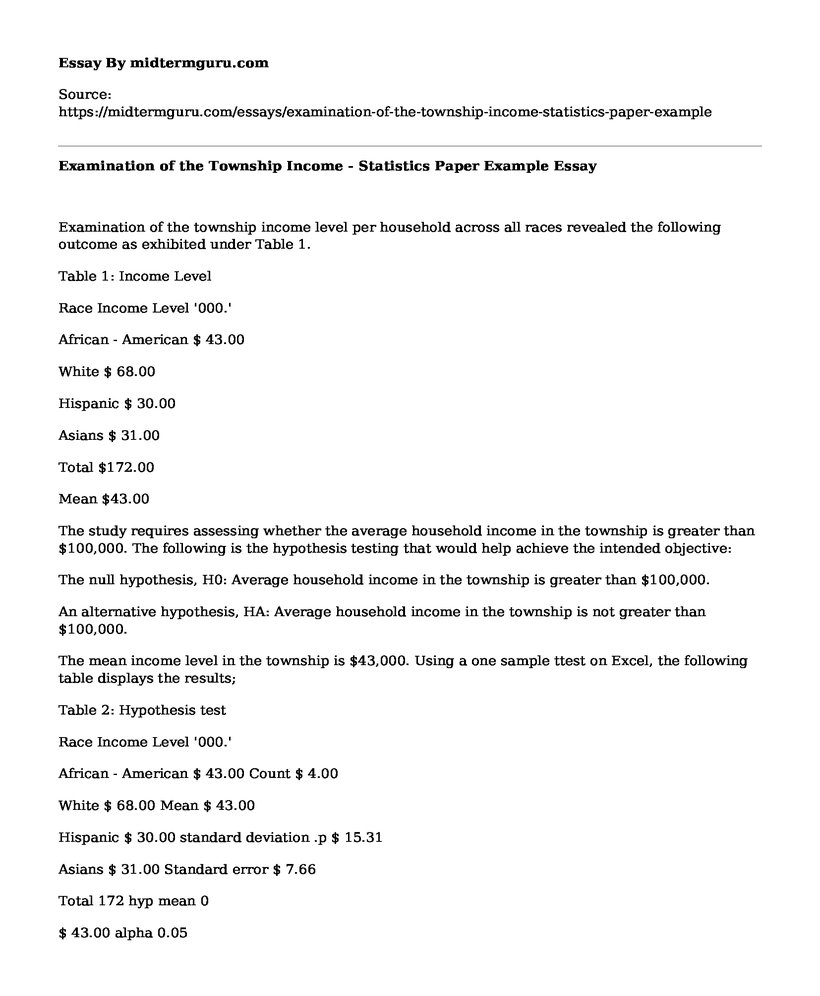
Examination of the township income level per household across all races revealed the following outcome as exhibited under Table 1.
Table 1: Income Level
Race Income Level '000.'
African - American $ 43.00
White $ 68.00
Hispanic $ 30.00
Asians $ 31.00
Total $172.00
Mean $43.00
The study requires assessing whether the average household income in the township is greater than $100,000. The following is the hypothesis testing that would help achieve the intended objective:
The null hypothesis, H0: Average household income in the township is greater than $100,000.
An alternative hypothesis, HA: Average household income in the township is not greater than $100,000.
The mean income level in the township is $43,000. Using a one sample ttest on Excel, the following table displays the results;
Table 2: Hypothesis test
Race Income Level '000.'
African - American $ 43.00 Count $ 4.00
White $ 68.00 Mean $ 43.00
Hispanic $ 30.00 standard deviation .p $ 15.31
Asians $ 31.00 Standard error $ 7.66
Total 172 hyp mean 0
$ 43.00 alpha 0.05
tails 1
df 3.00
t stat $ 5.62
p value 0.005580626
t critical 2.353363435
sig yes
From the results, t stat > t critical. This implies that we reject the null hypothesis, thereby confirming that the average income level of households in the township is not greater than $100,000. The assertion is significant as revealed by pvalue (0.00055) < 0.05 (5% significance level) (Goatly, 2000).
Construct 95% CI for the proportion of households with the family history of heart disease, separately for each race.
Table 2 below reveals the results for CI interval constructed from the township population:
Table 2: 95% CI
Race Family History of Heart Disease 95% CI
African - American 8 7.123852
White 28 3.807859
Hispanic 6 8.225916
Asians 1 20.1493
Total 43
Standard Deviation 10.28044
Alpha 0.05
Population size 43
The CI is calculated using Excel confidence function. The assessment only takes the proportion of families with a history of heart disease across each race (Jackson, 2016). As revealed in the results, it can be shown that the White race has the smallest range, followed desperately by African-American race. Asians have the highest range. This implies that the prevalence of heart disease is risky among White than any other population (Carmo, 2016).
References
Carmo, M. (2016). Differential geometry of curves & surfaces. Mineola, New York: Dover Publications, Inc.
Goatly, A. (2000). Critical reading and writing: an introductory coursebook. London New York: Routledge.
Jackson, S. (2016). Research methods and statistics: a critical thinking approach. Singapore: Cengage Learning.
Cite this page
Examination of the Township Income - Statistics Paper Example. (2021, May 28). Retrieved from https://midtermguru.com/essays/examination-of-the-township-income-statistics-paper-example
If you are the original author of this essay and no longer wish to have it published on the midtermguru.com website, please click below to request its removal:
- Average Amount Mall Customers Spend on Food - Statistics Paper Example
- Essay on Fishers Linear Discriminant Analysis
- Methodological Approaches Used to Gather Data Analysis Essay
- Paper Example on Dependent and Independent Samples in Hypothesis Testing
- Generalizing Qualitative Research: Challenges & Opportunities - Essay Sample
- Types of Variables in Research: Categorical & Discrete - Essay Sample
- 3M: Gaining Success Through Key Presentations & More - Essay Sample


