Introduction
The underlying concept of statistical process control is grounded on a comparison of what is occurring today with the previous occurrences. A snapshot is taken of how the process generally performs before calculating control limits for the expected measurements of the output process. The first stage of statistical process control (SPC) is the original establishment of the process and the second stage is the constant production use of the process. Numerous processes have multiple sources of variation; most of them are limited and can be ignored. The data measurement of differences at facts on the process chart is tracked using control graphs. Process capability analysis is a set of tools utilized to analyze how well a given process fulfills a set of specification controls (Sargut, & Demirors, 2006). In reality, it compares the distribution of sample values-signifying the process result-to the specification restrictions.

It is crucial for a business to influence various IT resources for imperceptible assistances. Process capability analysis enables a business to meet its needs, organize IT to advance the business process in a cost-efficient way and to offer long-standing preservation and support for IT-oriented frameworks. General wisdom in the domain of information technology informs that firms should be mature enough to apply SPC techniques. When business processes do not stimulate any of the control diagram 'detection rules' for the control chart, they are said to be 'stable' (Render, Stair, & Hanna, 2017). Process capability analysis is undertaken to forecast the ability of a business process to generate 'conforming product' in the future.
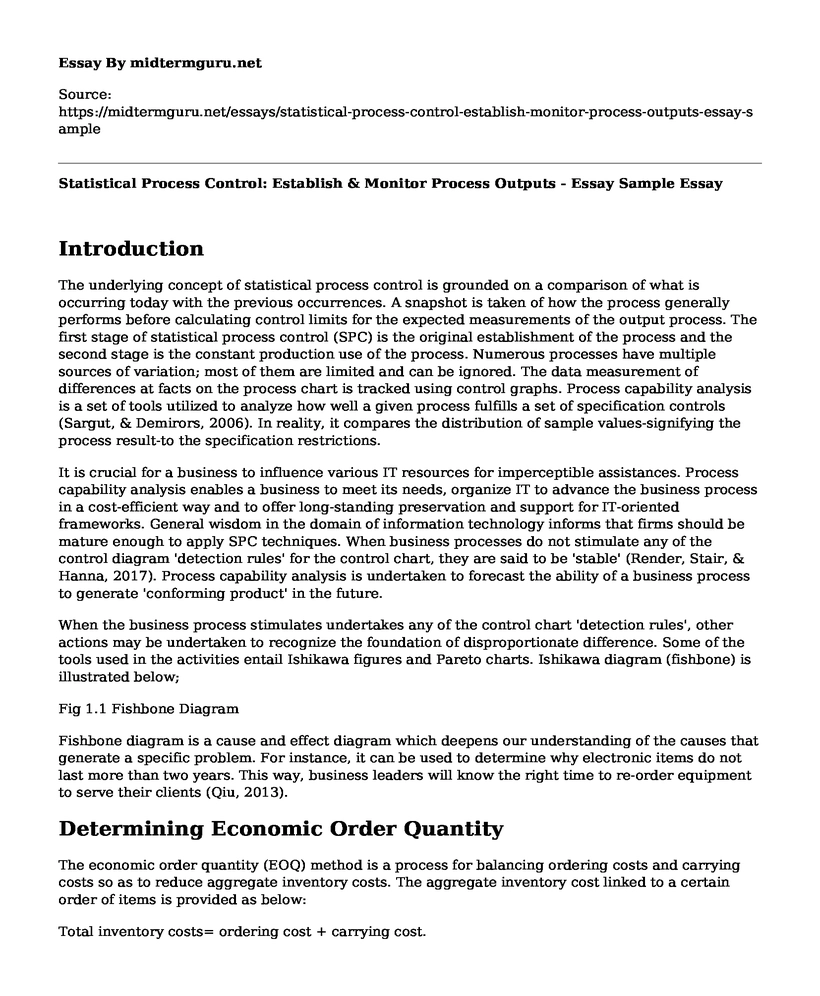
When the business process stimulates undertakes any of the control chart 'detection rules', other actions may be undertaken to recognize the foundation of disproportionate difference. Some of the tools used in the activities entail Ishikawa figures and Pareto charts. Ishikawa diagram (fishbone) is illustrated below;
Fig 1.1 Fishbone Diagram
Fishbone diagram is a cause and effect diagram which deepens our understanding of the causes that generate a specific problem. For instance, it can be used to determine why electronic items do not last more than two years. This way, business leaders will know the right time to re-order equipment to serve their clients (Qiu, 2013).
Determining Economic Order Quantity
The economic order quantity (EOQ) method is a process for balancing ordering costs and carrying costs so as to reduce aggregate inventory costs. The aggregate inventory cost linked to a certain order of items is provided as below:
Total inventory costs= ordering cost + carrying cost.
The goal is to stabilize the costs and order such quantity so as to minimize the aggregate inventory cost. The more items ordered per order, the reduction in the ordering cost due to the fewer number of orders in a given period. Nevertheless, it will escalate the carrying cost. On the other hand, more recurrent orders will intensify the ordering costs but minimize the inventory carrying cost. In the information technology sector, there is a fixed cost for each order placed, irrespective of the number of units orders (Oakland, 2008). There is also cost for storing electronic items which is referred to as holding cost.
Using fundamental calculus, a mathematical model can be designed to compute the economic order quantity. The following formula calculates EOQ:
In statistics process control, EOQ is crucial because it enables business leaders to plan their inventories and control them. It ensures that there are no shortages or excess in inventories.
References
Oakland, J.S. (2008). Statistical Process Control. Routledge.
Qiu, P. (2013). Introduction to Statistical Process Control. CRC Press.
Render, B., Stair, R., & Hanna, M. (2017). Quantitative Analysis for Management. New York: Pearson Prentice Hall.
Sargut, K. U., & Demirors, O. (2006). Utilization of statistical process control (SPC) in emergent software organizations: Pitfalls and suggestions. Software Quality Journal, 14(2), 135-157.
Cite this page
Statistical Process Control: Establish & Monitor Process Outputs - Essay Sample. (2023, Jan 31). Retrieved from https://midtermguru.com/essays/statistical-process-control-establish-monitor-process-outputs-essay-sample

so we do not vouch for their quality

If you are the original author of this essay and no longer wish to have it published on the midtermguru.com website, please click below to request its removal:
- Essay on Managing Staff in High-Risk Countries
- Leadership Stories: Abdullah, the King of Arabia
- Levenes Test for Equality of Variances T-Test for Equality of Means
- Essay on Decision Making Skills in Business Ownership
- 401 Games Company Case Study: Marketing Plan - Paper Example
- Article Analysis Essay on "Reality Check on Non-Profit Marketing"
- RR Communications: Four Autonomous Business Divisions - Essay Sample


